Vegetation phenology - the study of seasonal vegetation cycles such as leaf-out, flowering, and senescence - is one of the oldest sciences that humans have studied for thousands years.
First historical records have been collected in China around 2000 years ago (Ge et al. 2007), but were mostly related to non-agricultural observations, while phenological records on plants and animals became diffuse since the XII century in China (Ge et al. 2007). The oldest phenological records of cherry trees blossoming were made in Kyoto, Japan and date back to the IX century (Aono and Kazui 2007). These historical phenological data have been widely used as proxies to reflect past climatic changes around the world, especially in Europe and Asia.
The term “phenology” was first proposed by the Belgian botanist Charles Morren in 1853, but the father of modern plant phenology and phenological observation networks is the Swedish botanist Carolus Linnaeus. In Philosophia Botanica (Linne' 1763), Linnaeus outlined methods for compiling calendars of plant “phenophases”, together with climatological observations, and started the first phenological network in Sweden and Finland 1750–1752 (Hopp 1974). The “modern era” of plant phenology studies have then found a large diffusion in Europe thanks to Egon Ihne, a pioneering German botanist and meteorologist who spearheaded the extensive Hoffmann–Ihne phenological network, collecting plant and animal seasonal timing data across Europe from 1883 to 1941 (Hopp 1974) .During the same period, the recording of the appearance and development of plants and animals became a national pastime and, between 1891 and 1948, the Royal Meteorological Society (RMS) organised a programme of phenological recording across the British Isles. After the 1950s, the idea of International Phenological Gardens with a cloned set of plants was born, which resulted in expanding phenological networks in Europe (Sofiev and Bergmann 2013).
Methods to study phenology
History
Before the modern era, historical methods to collect phenological observations were direct observations recorded in diaries, journals, and calendars. Long before formal agricultural science, phenology was embedded in agriculture and traditional ecological knowledge, such as planting and harvesting schedules based on seasonal cues, and “phenological calendars” (e.g. in China, ancient Greece). An interesting early phenological description and explanation of the olive ripening process could be found in the Hellenistic expert of botany (and Aristotle’s follower) Theophrastus, when saying that in early autumn “the (olive) fruit gets no increase of oil beyond the amount it received in summer, and that at this time the stone also gets hard, after which date the trees are no longer able to turn their fluid to oil” (Theophrastus, 6.8.1). Similar seasonal observations can be found in Roman (Menologia rustica) and Muslim calendars (Ferrara and Ingemark 2023), and many authors such as Pliny the Elder’s Natural History, which discussed the importance of phenology and meteorology (Millar 2021). During the Tang and Song Dynasties (618–1279 CE), phenological events were widely recorded in classical Chinese poetry (Liu et al. 2021).
Herbarium
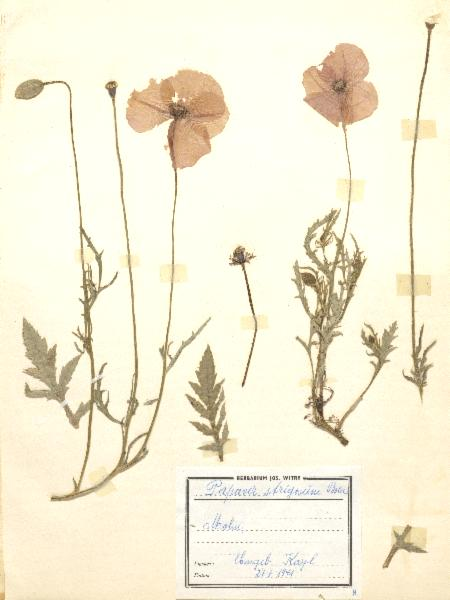
At another level, herbarium specimens, which have been collected since the XVII century, have been recognized as a reliable source for estimating phenological behavior for a diversity of plant species, and its importance have grown in modern phenology due to advances in digital technology, which allowed massive digitization efforts, developing efficient methods and standards for gathering and making the data fully accessible online (Willis et al. 2017).
Towards modern era
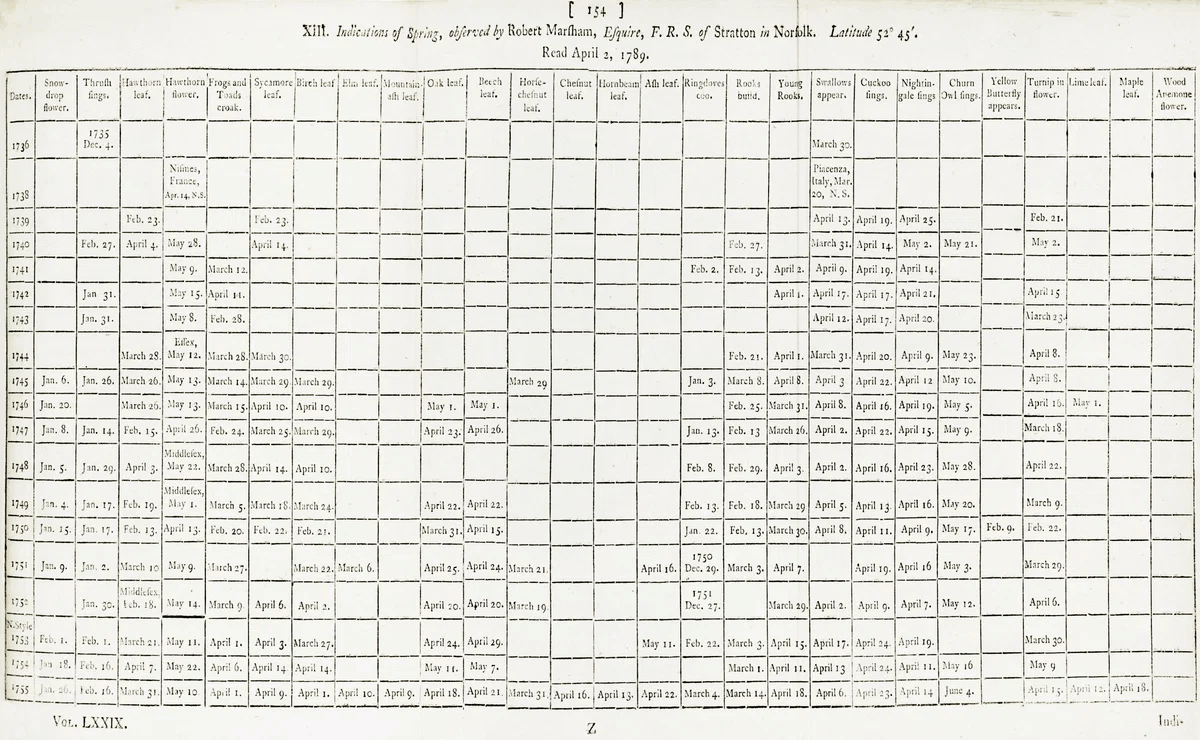
Robert Marsham was a landowner who kept systematic records of “indications of spring” on his estate at Stratton Strawless, Norfolk from 1736, and his family keep collecting consistent records of the same events or “phenophases” over unprecedentedly long periods of time, eventually ending with the death of Mary Marsham in 1958 (“XIII. Indications of Spring, Observed by Robert Marsham, Esquire, F. R. S. Of Stratton in Norfolk. Latitude 52° 45’” 1789).
Following the pioneering work of Marsham, phenological observation increasingly developed into a coordinated scientific practice, with observers recording standardized events across multiple sites and years. These early efforts laid the groundwork for later national and international phenological networks in the nineteenth century, which emphasized comparability, replication, and the systematic recording of first-occurrence dates and other phenophases.
Modern phenology networks
In Europe, national observation systems were progressively integrated into broader initiatives such as the European Phenology Network (EPN), aimed at harmonizing data collection protocols, improving accessibility, and enabling cross-country comparisons of phenological responses to climate variability.
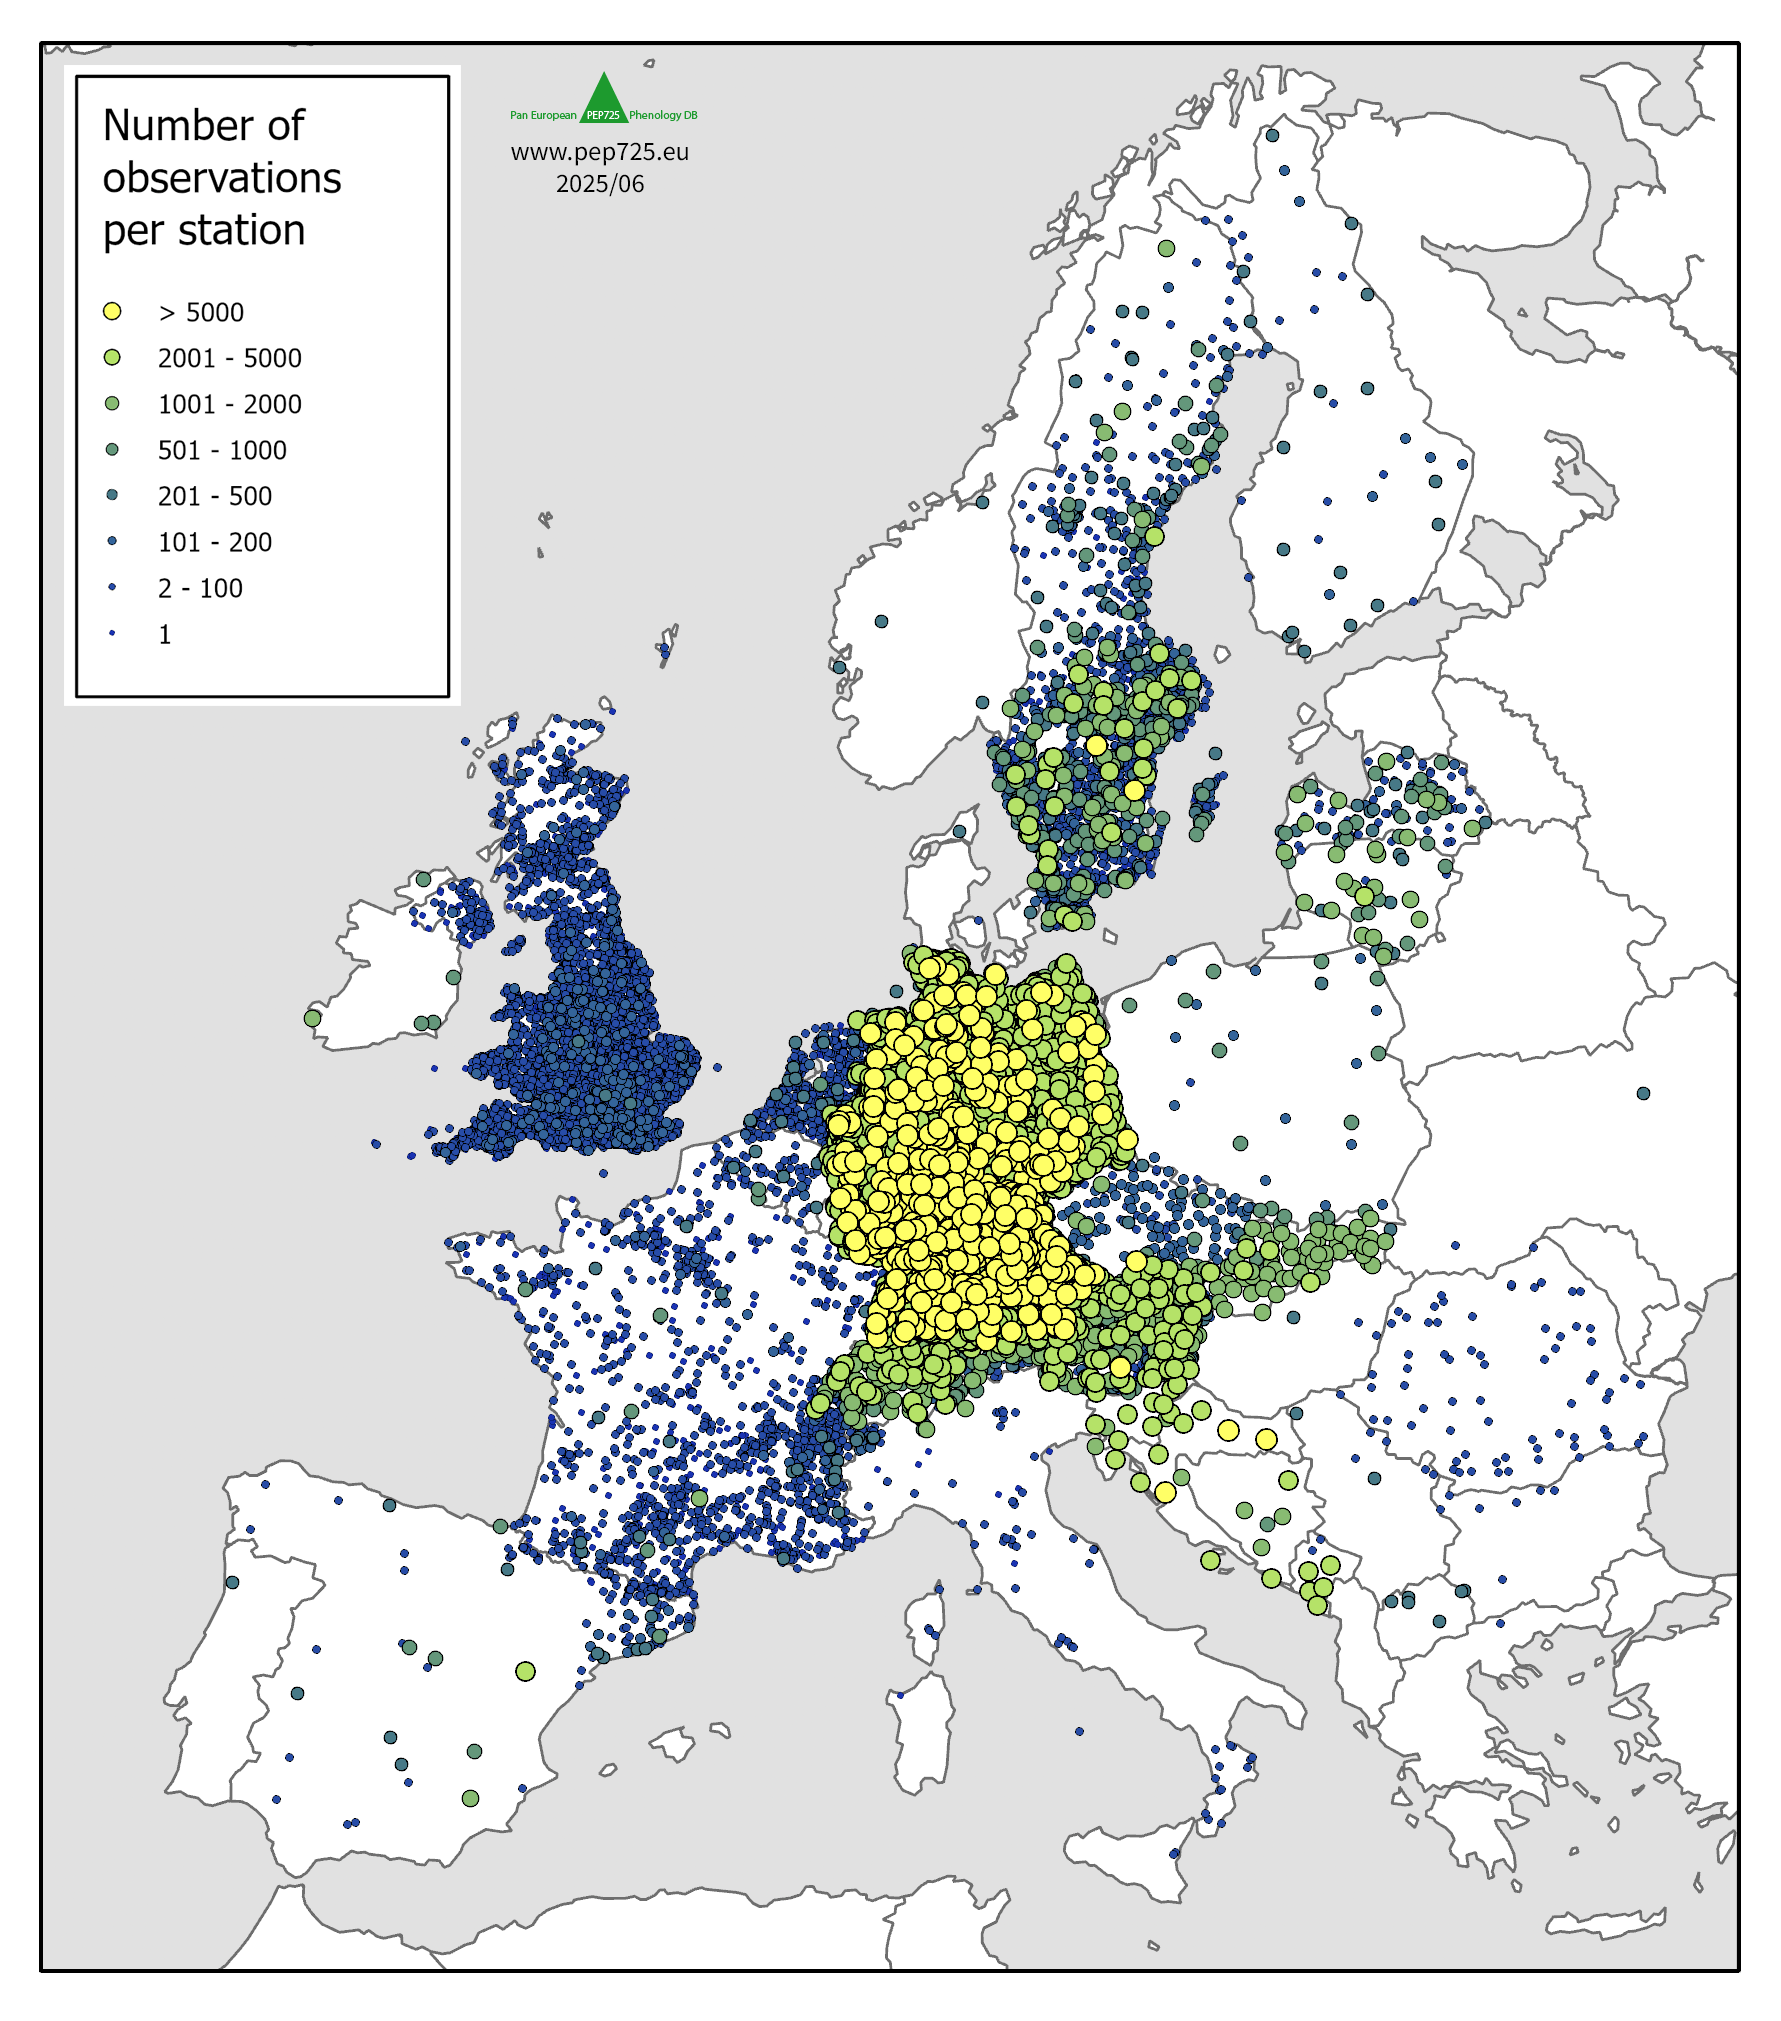
Similarly, large databases such as PEP725 aggregate phenological observations from multiple national networks into a standardized pan-European dataset, allowing long-term and large-scale analyses of plant phenology (Templ et al. 2026). .
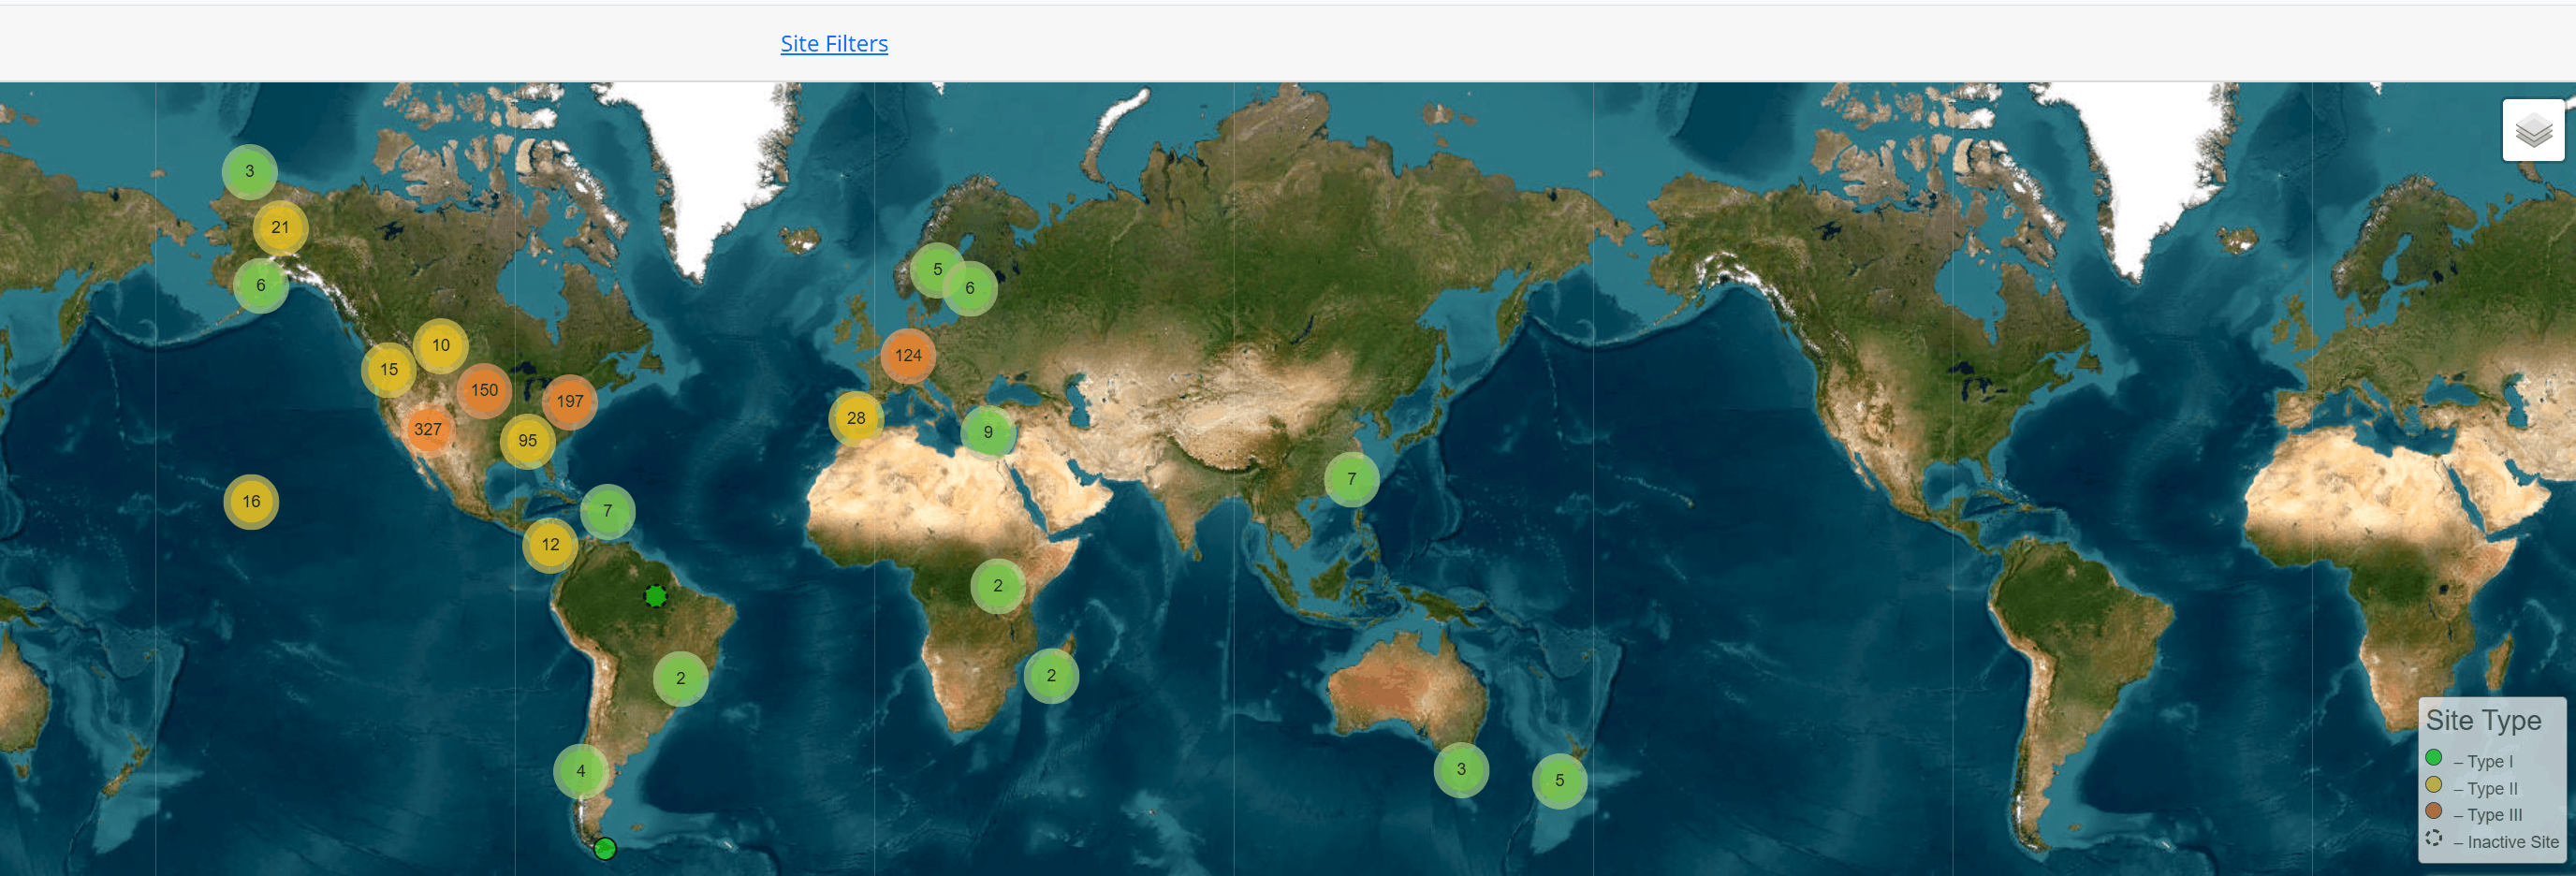
With the progress in ubiquitous technologies like smartphones, Citizen science is becoming an important way to non-specialists contribute observations of seasonal events. Modern networks such as the USA National Phenology Network explicitly rely on volunteer observers to collect standardized data on plant and animal phenophases across large spatial scales. Global data platform like the Global Biodiversity Information Facility (gbif.org) and iNaturalist allow studying phenology using citizen data.
Remote sensing
Despite their strengths, ground-based networks remain spatially limited. A major breakthrough came with the advent of satellite remote sensing, which enabled the observation of vegetation phenology continuously over large spatial scales.
From the late 20th century onward, phenology began to be studied using spectral vegetation indices (VIs), derived from multispectral satellite sensors. Among these, the Normalized Difference Vegetation Index (NDVI) became the most widely used metric. NDVI exploits the contrast between red and near-infrared reflectance to quantify vegetation “greenness” and photosynthetic activity.
Satellite phenology provides a unique way to answer large scale and long-term phenological research questions, including climate-change. The recent advances in Google Earth Engine (GEE) is further supporting faster, wider and powerful applications involving satellite phenology.
Proximal sensing
To bridge the gap between ground observations and satellite data, a new class of intermediate-scale observations has emerged: near-surface remote sensing using digital cameras, commonly referred to as PhenoCams.
The PhenoCam Network, established in 2008, is a continental-scale observatory that uses automated digital cameras to monitor vegetation phenology across hundreds of sites. These systems acquire high-frequency images (typically every 30 minutes), from which quantitative indices of canopy greenness are derived. Phenophases are then inferred from the annual time series of grenness.
Phenocams have been widely used for long-term monitoring, supporting evidences on large scale alteration in plant phenology, animal migration, biotic and abiotic disturbance events over the past thirty years (Brown et al. 2016).
From Phenocam to trail cameras
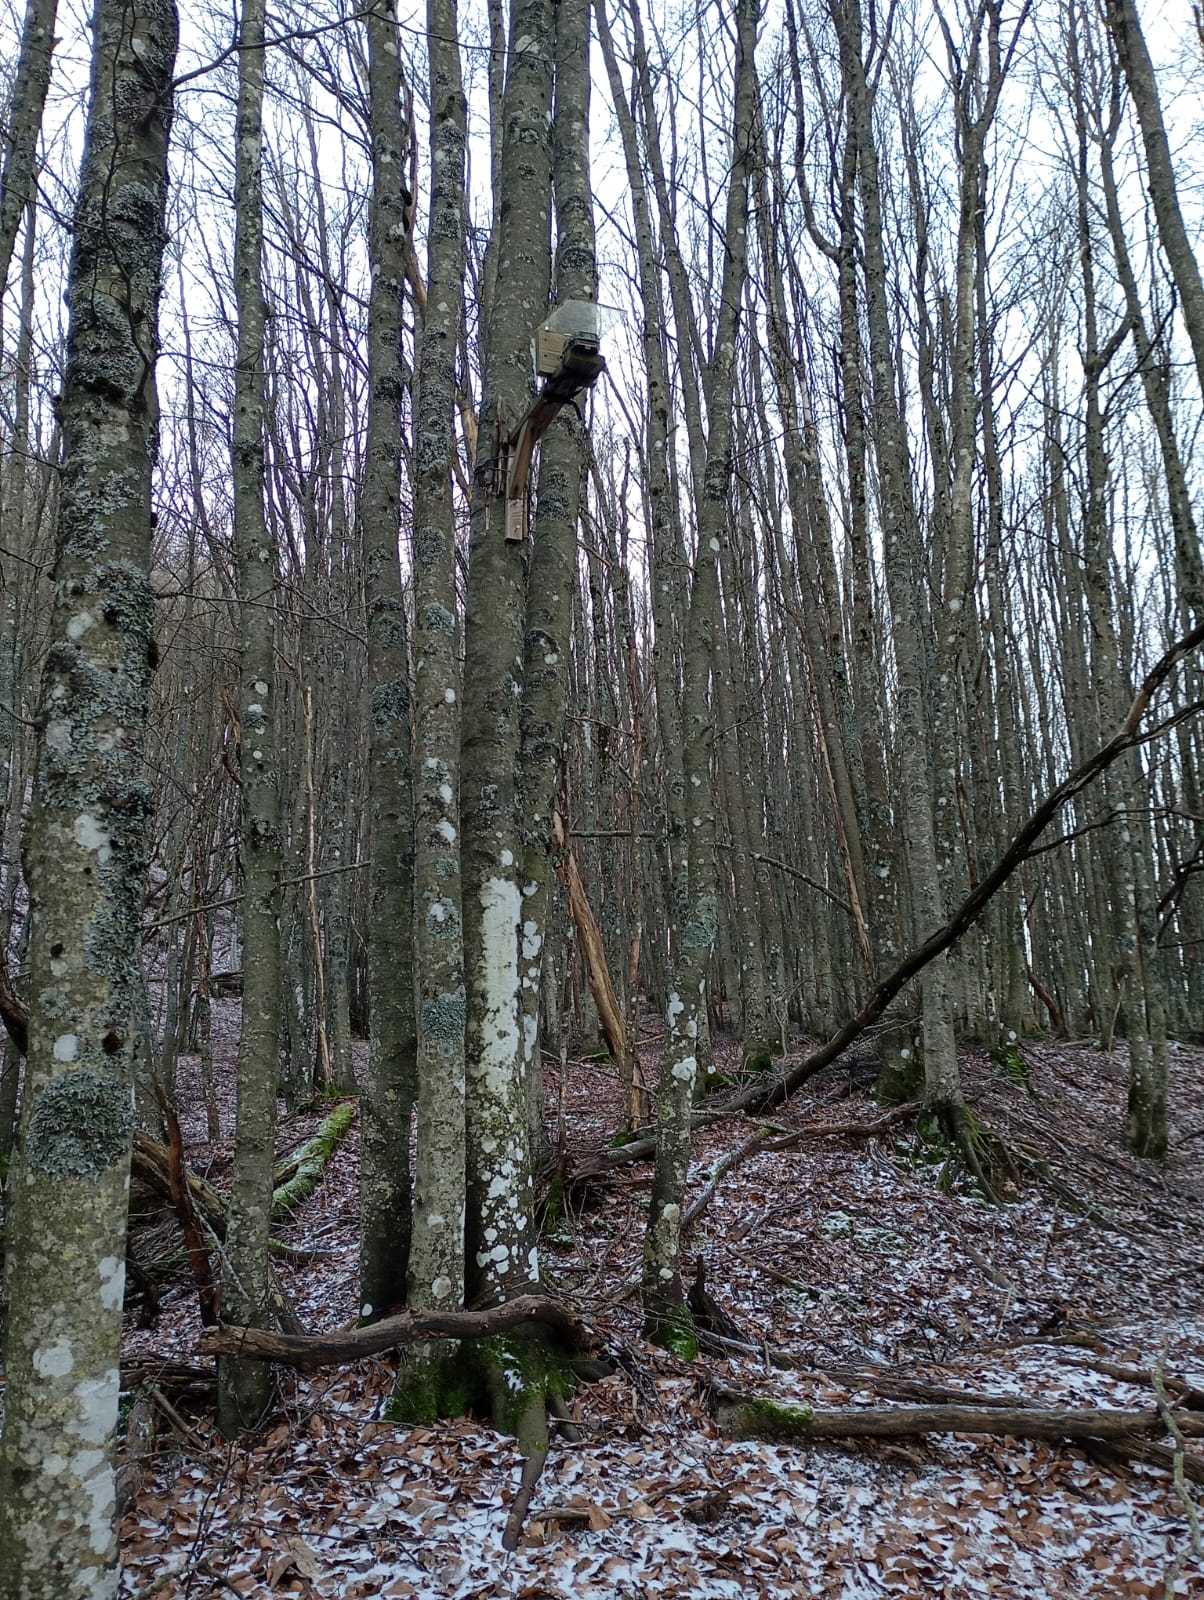
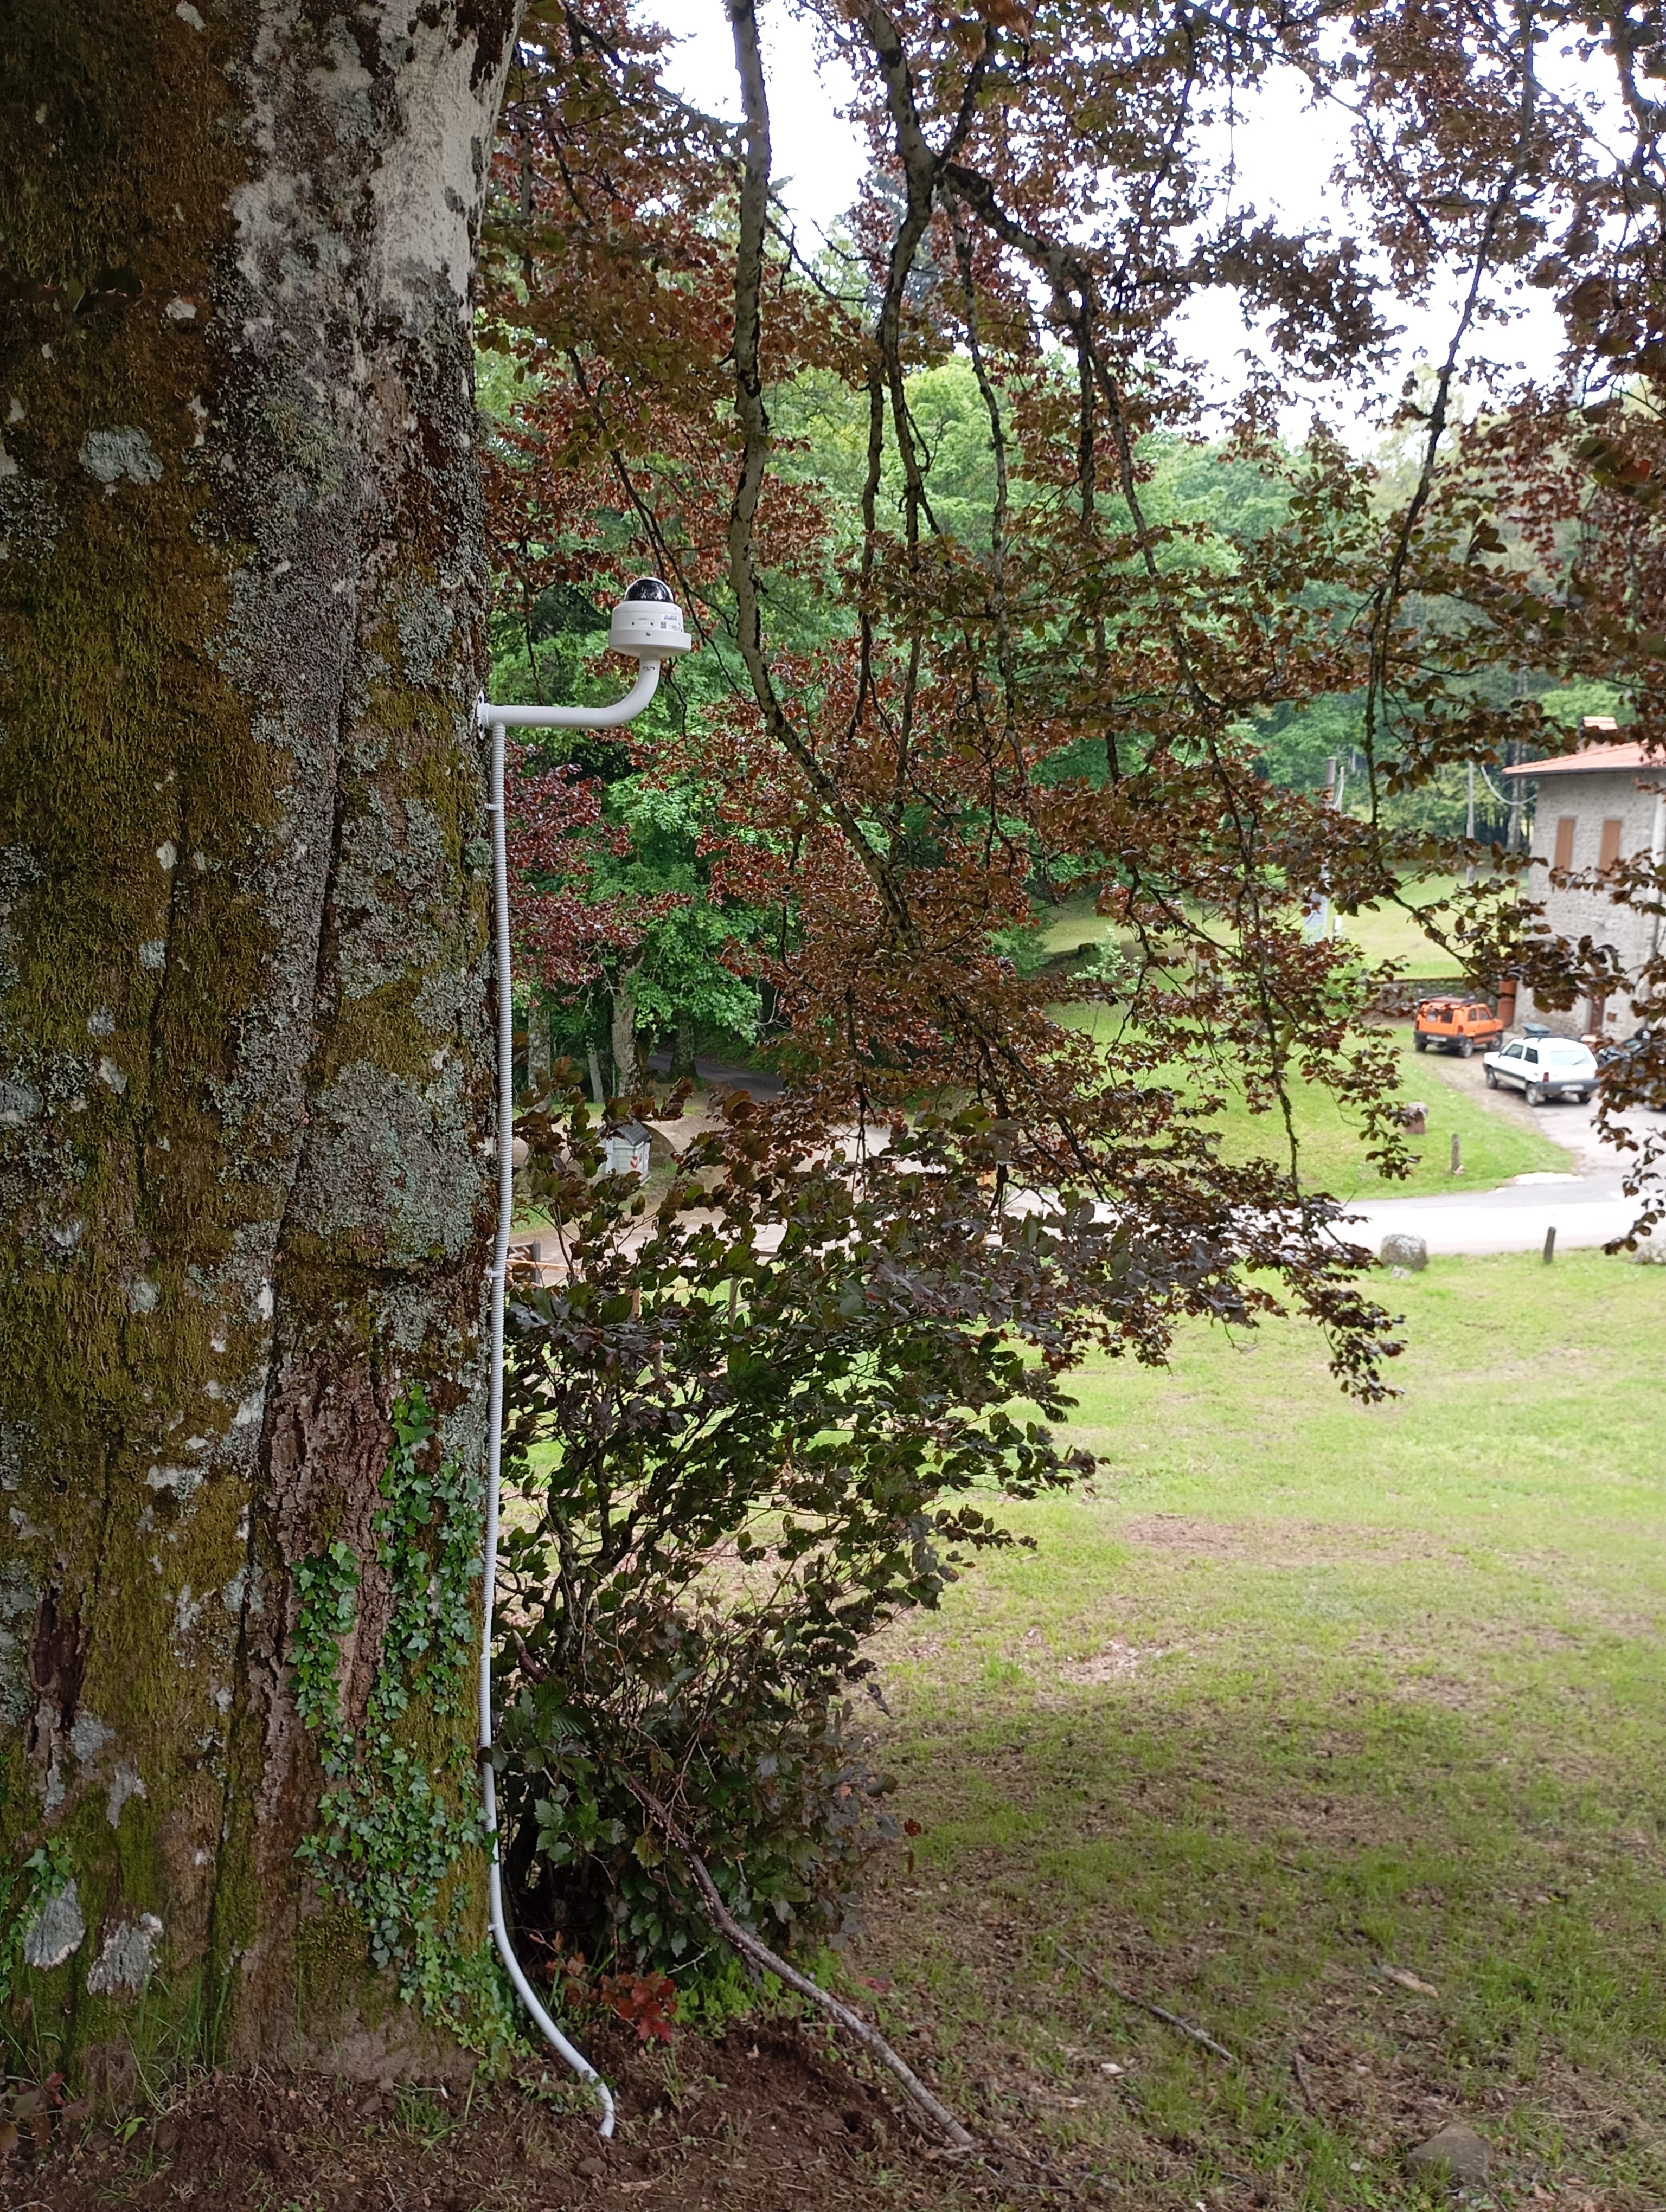
In recent times, studies pointed out that standard below-canopy digital repeat cameras, including camera traps and security webcams, can provide a cheap, simple and flexible solution for short term monitoring. Based on these considerations, I have created CrowNet, a monitoring system based on digital trail cameras, configured to capture time-lapses, avoiding the need of further equipment and installation needs.
In two previous studies (Chianucci, Bajocco, and Ferrara 2021; Chianucci et al. 2025) I demonstrated the method was effective in reliably estimating daily canopy cover, and infer green phenophases from daily time series.
The main limitations of CrowNet monitoring system are the need to improve the weatherproofing camera system, the automation in screening procedure, and the implementation of a online transmission protocol for remotely-check data acquisition and storage, while allowing remote processing of the images.
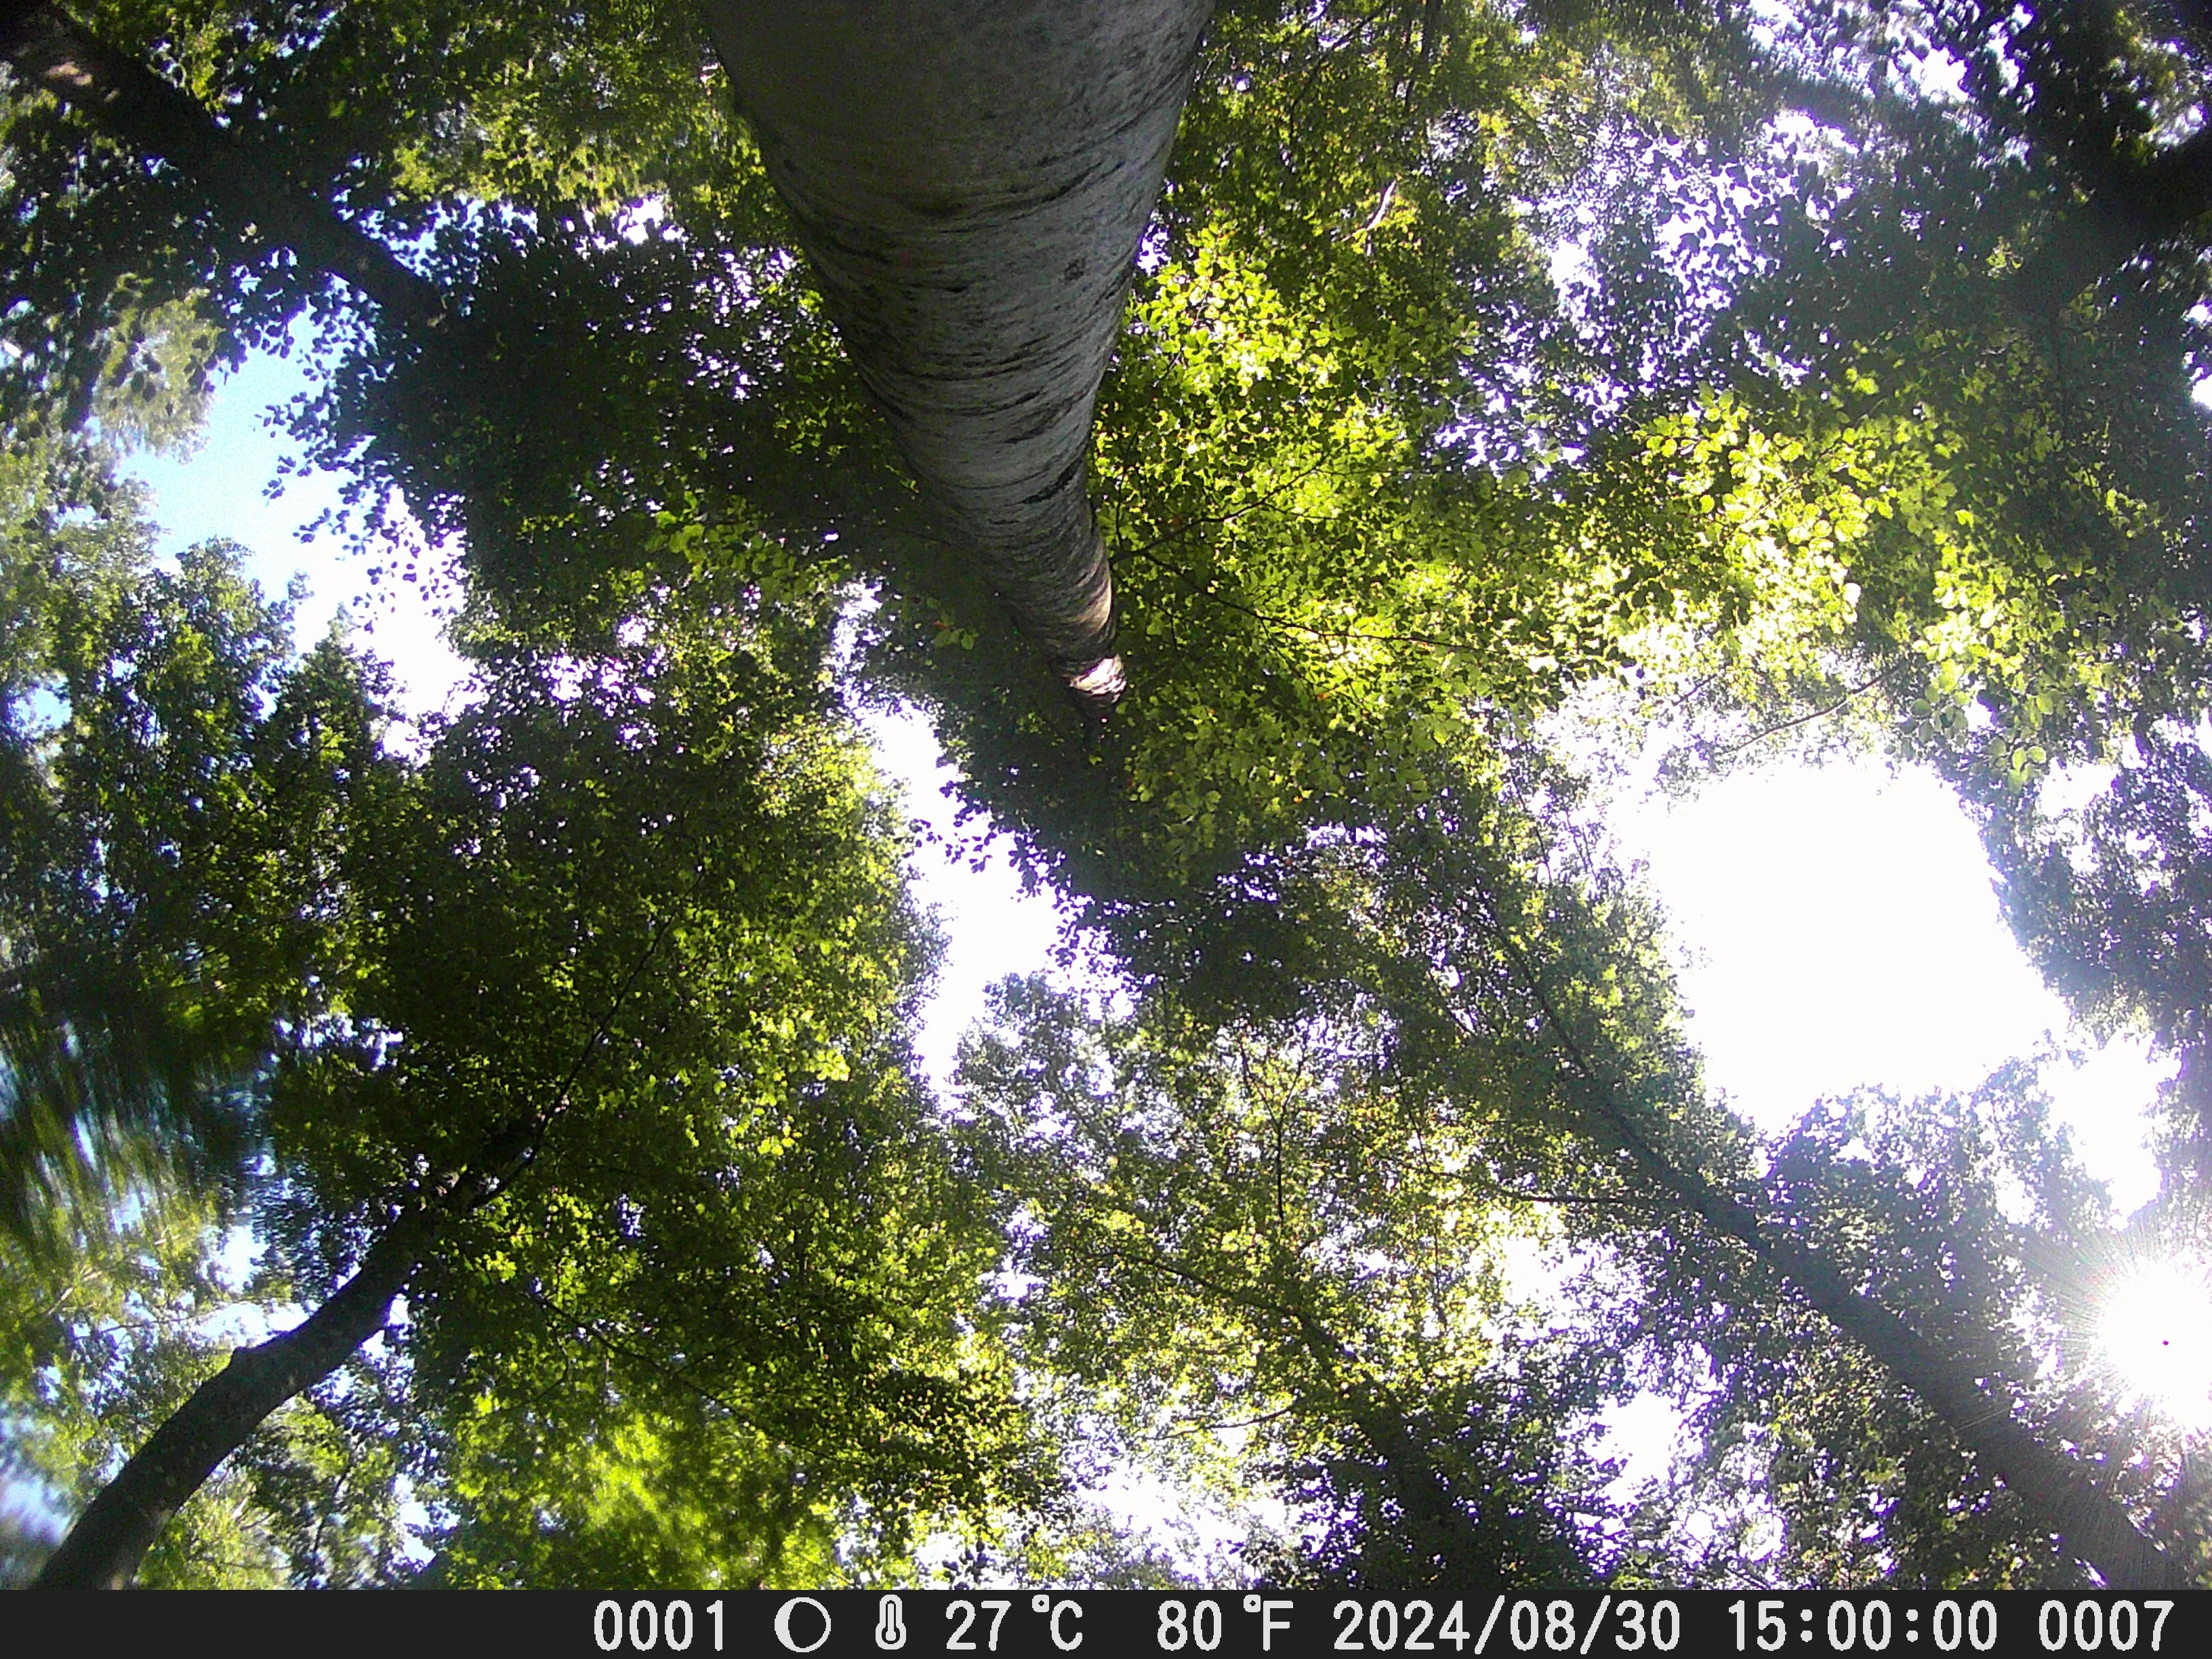
Recently, I am testing an improved monitoring system CrowNet 2.0, using security web-cams, which are continuously power-supplied, and programmed to automatically acquire images at 30’ interval; image are both locally stored in the NAS, and trasmitted, via internet connection to a SFTP server.
Data were then processed monthly using a R routine via VPN connection. Sub-daily canopy image were then quality-checked using automated screening filters, which isolated most of the variability due to adverse weather, unevend sky conditions and sunglares.
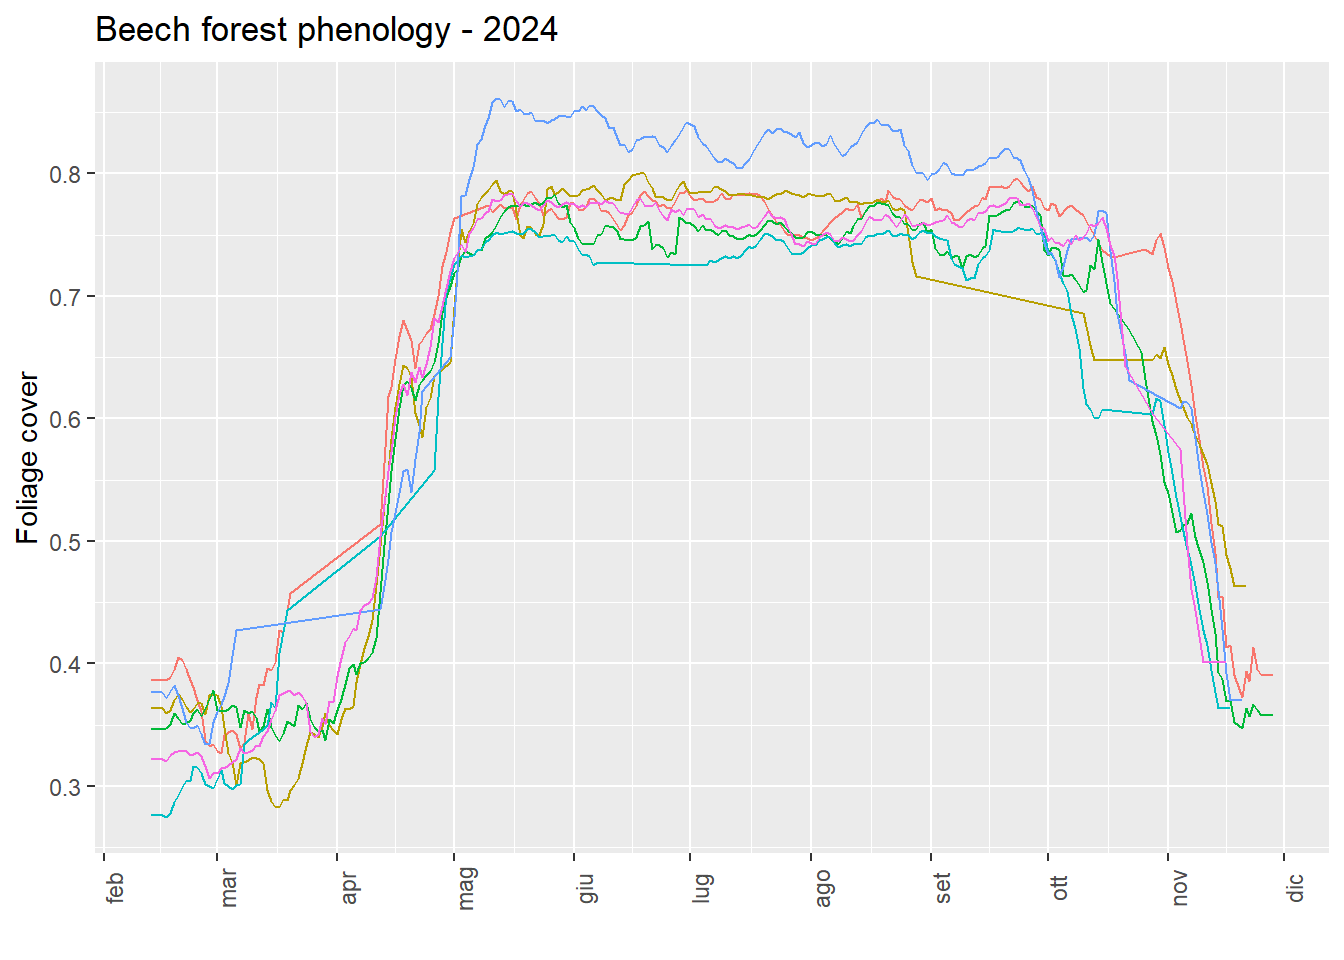
I am currently testing the method in beech forests, to evaluate if the improvements are making this system fully operational in ground canopy and phenology monitoring.
Below you can see one year data up to 31 may 2026 obtained in a beech stand using CrowNet 2.0 system:
References
Aono, Yasuyuki, and Keiko Kazui. 2007. “Phenological Data Series of Cherry Tree Flowering in Kyoto, Japan, and Its Application to Reconstruction of Springtime Temperatures Since the 9th Century.” International Journal of Climatology 28 (7): 905–14. https://doi.org/10.1002/joc.1594.
Brown, Tim B, Kevin R Hultine, Heidi Steltzer, Ellen G Denny, Michael W Denslow, Joel Granados, Sandra Henderson, et al. 2016. “Using Phenocams to Monitor Our Changing Earth: Toward a Global Phenocam Network.” Frontiers in Ecology and the Environment 14 (2): 84–93. https://doi.org/10.1002/fee.1222.
Chianucci, Francesco, Sofia Bajocco, and Carlotta Ferrara. 2021. “Continuous Observations of Forest Canopy Structure Using Low-Cost Digital Camera Traps.” Agricultural and Forest Meteorology 307 (September): 108516. https://doi.org/10.1016/j.agrformet.2021.108516.
Chianucci, Francesco, Alice Lenzi, Emma Minari, Matteo Guasti, Silvia Gisondi, Marco Gonnelli, Simone Innocenti, et al. 2025. “CrowNet: A Trail-Camera Canopy Monitoring System.” Agricultural and Forest Meteorology 372 (September): 110596. https://doi.org/10.1016/j.agrformet.2025.110596.
Ferrara, Vincenza, and Dominic Ingemark. 2023. “The Entangled Phenology of the Olive Tree: A Compiled Ecological Calendar ofOlea EuropaeaL. Over the Last Three Millennia With Sicily as a Case Study.” GeoHealth 7 (3). https://doi.org/10.1029/2022gh000619.
Ge, Quansheng, Jingyun Zheng, Yanyu Tian, Wenxiang Wu, Xiuqi Fang, and Wei-Chyung Wang. 2007. “Coherence of Climatic Reconstruction from Historical Documents in China by Different Studies.” International Journal of Climatology 28 (8): 1007–24. https://doi.org/10.1002/joc.1552.
Hopp, Richard J. 1974. “Plant Phenology Observation Networks.” In, 25–43. Springer Berlin Heidelberg. https://doi.org/10.1007/978-3-642-51863-8_3.
Linne', Carl von. 1763. “Philosophia Botanica, in Qua Explicantur Fundamenta Botanica Cum Definitionibus Partium, Exemplis Terminorum, Observationibus Rariorum, Adjectis Figuris Aeneis.” https://doi.org/10.5962/bhl.title.7066.
Liu, Yachen, Xiuqi Fang, Junhu Dai, Huanjiong Wang, and Zexing Tao. 2021. “Could Phenological Records from Chinese Poems of the Tang and Song Dynasties (6181279CE) Be Reliable Evidence of Past Climate Changes?” Climate of the Past 17 (2): 929–50. https://doi.org/10.5194/cp-17-929-2021.
Millar, Jane. 2021. “Roman Climate Awareness in Pliny the Elder’s Natural History.” Classical Antiquity 40 (2): 249–82. https://doi.org/10.1525/ca.2021.40.2.249.
Sofiev, Mikhail, and Karl-Christian Bergmann, eds. 2013. Allergenic Pollen. Springer Netherlands. https://doi.org/10.1007/978-94-007-4881-1.
Templ, Barbara, Helfried Scheifinger, Isabella Ostovary, Markus Ungersböck, and Hans Ressl. 2026. “PEP725 : 15years of Driving European and Global Phenology Science.” New Phytologist 250 (2): 717–34. https://doi.org/10.1111/nph.70869.
Willis, Charles G., Elizabeth R. Ellwood, Richard B. Primack, Charles C. Davis, Katelin D. Pearson, Amanda S. Gallinat, Jenn M. Yost, et al. 2017. “Old Plants, New Tricks: Phenological Research Using Herbarium Specimens.” Trends in Ecology & Evolution 32 (7): 531–46. https://doi.org/10.1016/j.tree.2017.03.015.
“XIII. Indications of Spring, Observed by Robert Marsham, Esquire, F. R. S. Of Stratton in Norfolk. Latitude 52° 45’.” 1789. Philosophical Transactions of the Royal Society of London 79 (December): 154–56. https://doi.org/10.1098/rstl.1789.0014.